Measurements of an eight-hour Windows protocol-plane soak
Test date 7 September 2026 · research report
This report gives the results of one continuous eight-hour test. A Node client sent frames to the Sync daemon over the WebSocket protocol on one Windows computer. The test measured daemon memory and the rate of frames the daemon accepted.
The test used no browser and no camera. It did not look at picture content. Read the Limitations section before you use these numbers. Several things that a reader can expect from a performance report were not measured here.
Configuration and method
What ran
| Item | Value |
|---|---|
| Harness | Sync repository, commit 2fd56ec, test/soak/run.mjs |
| Daemon | Built from source at commit 2fd56ec with MSVC 19.44 and vcpkg on the test computer. The daemon source is identical to the 0.2.56 release commit: native/ and CMakeLists.txt do not change between b0ecb9f and 2fd56ec. This is not the released 0.2.56 binary, which a different toolchain built. |
| Publisher mode | --test-receiver. The daemon used its test publisher. No camera, Syphon, Spout or NDI publisher ran. |
| Client | Node protocol client on a raw WebSocket. No browser, no renderer, no GPU readback. |
| Frame size | 1920 × 1080, constant. The test made no geometry changes. |
| Frame pacing | None. The client sent frames as fast as the connection accepted them. |
| Sender cycle | 60 s. The client closed and made a new sender every 60 s. |
| Duration | 28 800 s (8 h), from 04:20 to 12:20 UTC |
| Sampling | Every 1 s |
| Node | v24.14.1 |
| Operating system | Windows 11 Home, version 25H2, build 26200.9278 |
| Processor | Intel Core i7-12700F, 12 cores, 20 logical processors |
| Memory | 15.8 GB |
How the daemon was measured
The harness read two Windows counters for the daemon process once each second:
PrivateMemorySize64 (shown as private bytes, or footprint) and
WorkingSet64 (shown as RSS). Frame counts come from the daemon's own accepted
counter, read through the control protocol.
No other job ran on the computer during the test. A sidecar recorded the state of the continuous-integration runner on the same computer every 5 s: it found no active job at any point in the eight hours. Host processor use stayed at a median of 10.6 % and a 95th percentile of 15.4 %, which is the test itself.
Measurement results
Totals
| Measurement | Value |
|---|---|
| Accepted frames | 766 527 |
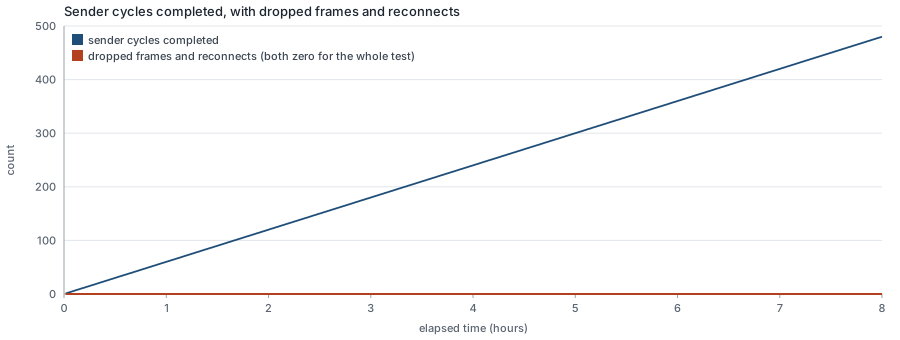
| Sender cycles completed | 480 |
| Dropped frames | 0 |
| Reconnects | 0 |
| Error records | 0 |
| Samples recorded | 28 800 |
| Missing samples | 0 |
The sample series has no discontinuity. Every second from 1 to 28 800 has one sample, and no sample has a null memory reading.
Daemon memory
| Counter | First | Last | Maximum | Change |
|---|---|---|---|---|
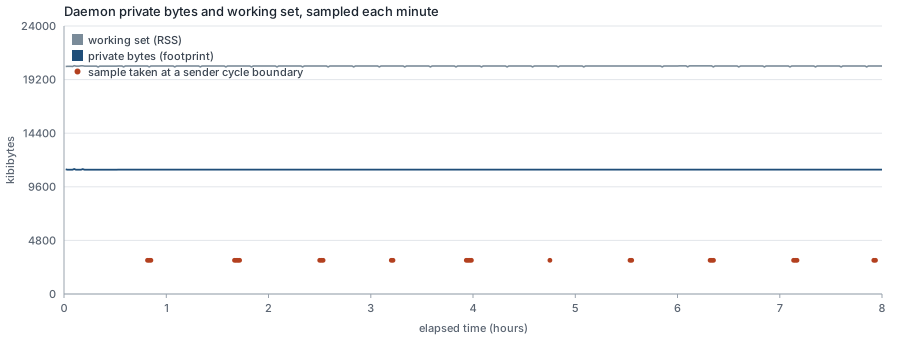
| Private bytes (KiB) | 11 256 | 11 140 | 11 260 | 0 |
| Working set (KiB) | 20 424 | 20 420 | 20 448 | −4 |
The reported growth is 0 KiB. The harness computes growth from the median of the first five and the last five samples of the measured window, which prevents one unusual sample at either end from setting the result. Two other calculations agree: an independent median calculation and the raw first-to-last difference both give 0 KiB.
Private bytes stayed between 11 128 and 11 260 KiB for the whole test, apart from 27 samples described in Dips. The daemon made and released 480 senders in this window and did not keep memory across them.
Rate of accepted frames
| Measurement | Value |
|---|---|
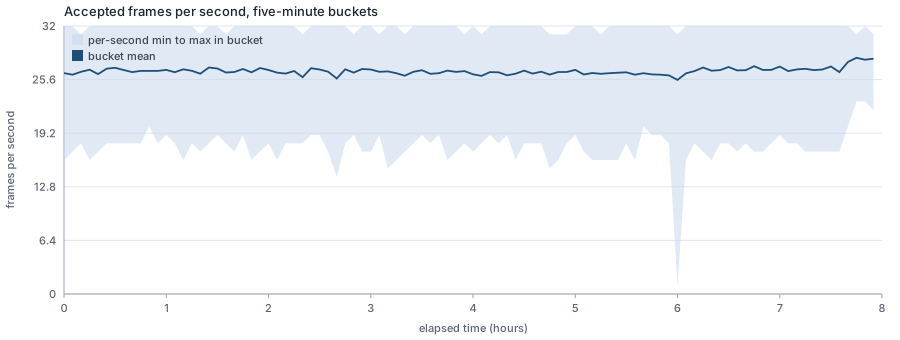
| Mean over the test | 26.6 frames per second |
| Lowest five-minute bucket | 25.6 |
| Highest five-minute bucket | 28.2 |
| Lowest one-second sample | 1 |
| Highest one-second sample | 39 |
This rate is not a target. Nothing limited the frame rate, so the number shows how fast this client, this daemon and this computer moved frames together. It is not a property of the daemon alone. See Limitations.
Dips and boundary samples
27 of the 28 800 memory samples (0.094 %) read about 3 016 KiB instead of about 11 140 KiB. These are real readings, and this report does not remove them.
Their cause is known. Each one falls in the short window when the client has closed one sender and has not yet opened the next, so the daemon has released the buffers for that sender. The seconds at which they occur move steadily through the 60 s cycle: the offset from the cycle boundary goes from 1 s to 10 s across the eight hours, because the 1 s sampler and the 60 s cycle drift against each other. A longer test always meets this condition again.
The same effect explains the lowest one-second frame counts. A second in which the sender closes and reopens carries fewer frames than a second of steady streaming.
Limitations
These results do not establish the performance of the released product. The following limits apply.
- No picture verification. The counts are frames that the daemon accepted through the protocol. They are not delivered frames, not unique frames, and not a rendered frame rate. Nothing in this test looked at picture content, so this test cannot show that a viewer saw a moving picture.
- The frame rate is limited by the test harness, not by the protocol. In
--test-receivermode the daemon's test publisher computes an FNV-1a checksum over every byte of every frame. That loop is a serial pass over the whole payload and is the probable limit on the rate reported here. Do not read the rate as a protocol or network capacity. - The camera path did not run. The camera publisher scales and rearranges each frame into a fixed canvas. That work never executed in this test, so this report says nothing about it.
- Graceful shutdown was not tested. Windows has no POSIX signals, so the
harness ends the daemon with
TerminateProcess. This test therefore makes no claim about a clean shutdown. - The daemon is a local build. Its source is identical to the 0.2.56 release commit, but a different toolchain built the released binary.
- One computer, one run. This computer has shown throughput differences of up to 5.4 % across two hours with an unchanged daemon binary, in both directions, and the cause is not known. Do not compare the absolute rate here against a rate measured elsewhere or at another time; the difference between two such numbers can be smaller than this computer's own variation.
- No temperature or power measurement. The test recorded processor use but not thermal or power state.
What this test does show. Over eight hours and 480 sender cycles, with 766 527 frames accepted, the daemon's private bytes did not grow, and the harness recorded no dropped frame, no reconnect and no error. That is a statement about memory behaviour on the protocol path on this operating system, and nothing more.
Provenance
| Item | Value |
|---|---|
| Harness revision | Sync repository commit 2fd56ec |
| Daemon source | Same commit. Identical to the 0.2.56 release commit for native/ and CMakeLists.txt. |
| Daemon build | MSVC 19.44, vcpkg, Release, on the test computer |
| Node | v24.14.1 |
| Test window | 2026-09-07, 04:20 to 12:20 UTC |
| Raw series | metrics.json |
metrics.json holds the five-minute buckets, the per-minute
resource series, and every one of the 27 boundary samples, so a reader can repeat the
calculations in this report. SHA256SUMS in this directory gives a SHA-256 hash
for every file.