Measurements of 1080p camera performance
Measurement data (JSON) · Artifact manifest · SHA-256 checksums
Configuration and method
This research fixture uses task-local ordered export and a bounded queue of raw frames. The queue processes frames in arrival order. The fixture includes experimental changes that the released product does not contain. These results do not establish performance of the released product or physical display output.
| Resolution and source | Noisedeck source A renders a GLSL test pattern at 1920 × 1080. The pattern contains sequence and time markers. |
|---|---|
| Data path | Ordered export sends frames to the Sync camera source. Receiver B reads the borrowed NV12 input. The ordinary media effect renders the final canvas. The observer reads that canvas after the same render. |
| Web runtime | Chrome 152.0.7977.77 runs the source and receiver in separate processes. |
| Desktop runtime | Electron 42.3.0 / Chrome 148.0.7778.180 runs the source and receiver in separate processes. |
| Run continuity | One source and receiver remain active for each run. The stream does not reset between report intervals. |
| Pixel controls | Three positive controls and three poison-negative controls check all pixels for each context before timing. During timing, the observer records marker identity. It does not archive full-color frames. |
| Selection and timing | The observer selects pairs with exact upload ordinals. It uses one-second intervals on a common local clock. Each interval includes its start and excludes its end. Late completions retain their reserved identities. Unique FPS divides unique pairs by the actual measurement duration, including the partial tail. |
| Acceptance criteria | Average ≥50 unique frames/s, every complete second ≥50, and sustained 60 are separate criteria. |
Measurement results
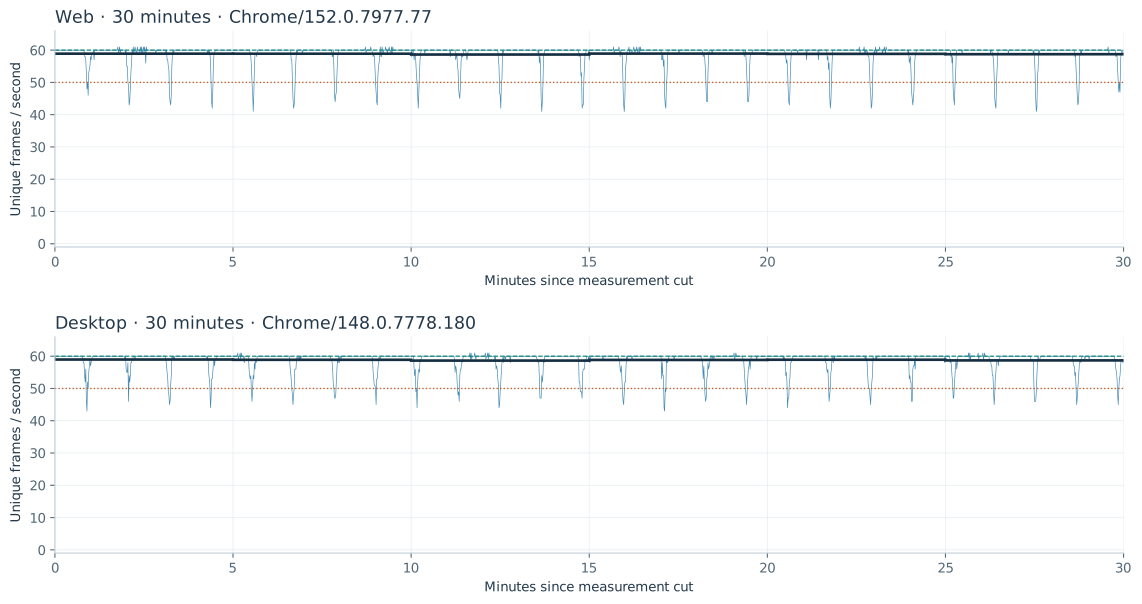
All three runs passed the diagnostic and cleanup checks. All selected input/final pairs matched, with zero invalid or reordered identities. Each run passed the average-50 criterion. No run passed the every-second-50 criterion or the sustained-60 goal. The report counts duplicate pairs separately and excludes them from unique FPS.
| Run | Actual duration (s) | Selected pairs | Unique | Duplicates | Unique FPS | Seconds <50 / complete seconds | Minimum |
|---|---|---|---|---|---|---|---|
| Web · 3 hours | 10800.017199999 | 642,082 | 628,778 | 13,304 | 58.220092464 | 787 / 10,800 | 0 |
| Web · 30 minutes | 1800.020400000 | 107,569 | 105,882 | 1,687 | 58.822666676 | 92 / 1,800 | 41 |
| Desktop · 30 minutes | 1800.008700001 | 105,932 | 105,877 | 55 | 58.820271258 | 68 / 1,800 | 43 |
Partial final cells
| Run | Duration (ms) | Input pairs | Final pairs | Final unique |
|---|---|---|---|---|
| Web · 3 hours | 17.199998856 | 1 | 1 | 1 |
| Web · 30 minutes | 20.399999619 | 1 | 2 | 2 |
| Desktop · 30 minutes | 8.700000763 | 1 | 1 | 1 |
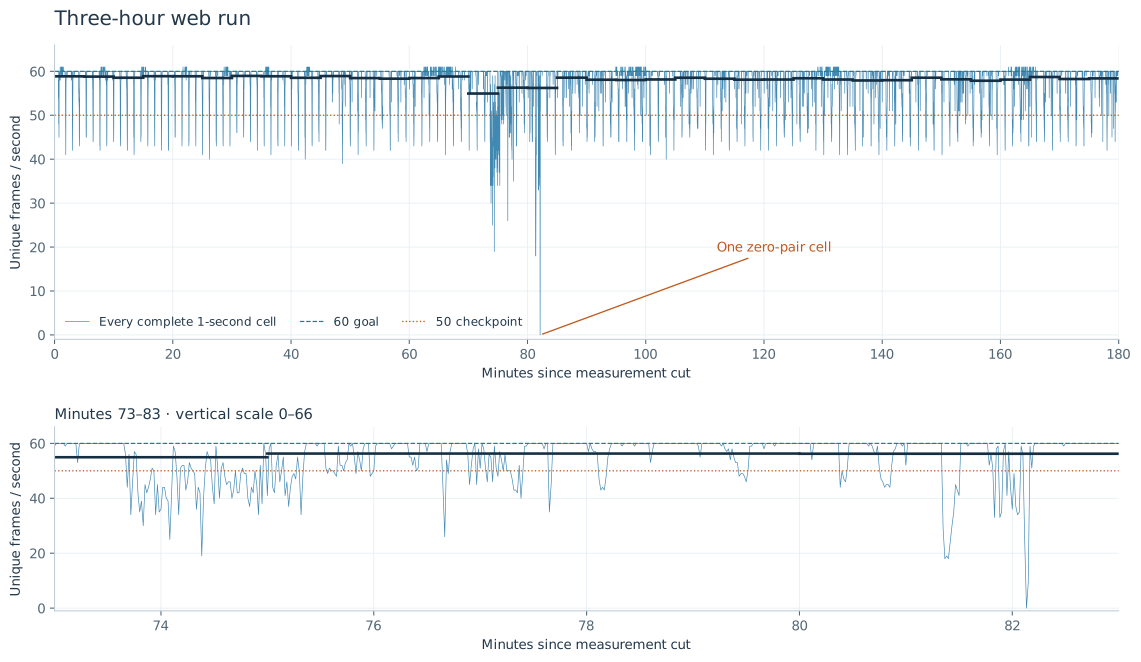
Intervals with low counts in the three-hour run
The three-hour run contains 787 complete seconds below 50 unique frames/s and one zero-pair second. At measurement second 4,928, approximately 14:18:28.720 UTC, both input and final observers recorded zero admitted pairs. The following second recorded 13 pairs: 9 unique and 4 duplicate. This is an observed-upload gap, not an invalid-marker event.
A receiver snapshot by minute 90 recorded a maximum render gap of 1,669.8 ms. The record does not contain its exact event clock or source progress for each second. Four new receiver processes first appeared in the adjacent resource sample. The times correlate, with approximately 55 ms of uncertainty in clock alignment. The cause remains unresolved.
All 11 complete seconds below 30 unique frames/s
| Second index | Elapsed mm:ss | Pairs | Unique | Duplicates |
|---|---|---|---|---|
| 4445 | 74:05 | 35 | 25 | 10 |
| 4463 | 74:23 | 26 | 19 | 7 |
| 4600 | 76:40 | 36 | 26 | 10 |
| 4881 | 81:21 | 29 | 29 | 0 |
| 4882 | 81:22 | 19 | 18 | 1 |
| 4883 | 81:23 | 23 | 19 | 4 |
| 4884 | 81:24 | 20 | 18 | 2 |
| 4885 | 81:25 | 27 | 24 | 3 |
| 4927 | 82:07 | 26 | 25 | 1 |
| 4928 | 82:08 | 0 | 0 | 0 |
| 4929 | 82:09 | 13 | 9 | 4 |
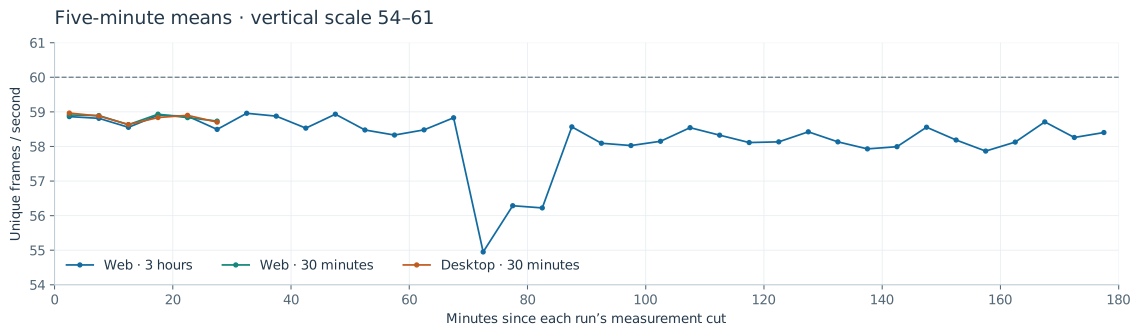
The final five minutes contain 17,521 unique pairs and 316 duplicate pairs. The mean is 58.403333 unique frames/s. The minimum is 42, with 18 complete seconds below 50. The interval series does not indicate monotonic degradation across the full run.
Three-hour five-minute intervals
| Minutes | Unique | Duplicates | Unique FPS | Minimum one-second count | Seconds <50 |
|---|---|---|---|---|---|
| 0–5 | 17,659 | 268 | 58.863333 | 41 | 15 |
| 5–10 | 17,644 | 282 | 58.813333 | 42 | 17 |
| 10–15 | 17,566 | 342 | 58.553333 | 41 | 22 |
| 15–20 | 17,671 | 261 | 58.903333 | 42 | 15 |
| 20–25 | 17,663 | 259 | 58.876667 | 43 | 14 |
| 25–30 | 17,548 | 342 | 58.493333 | 40 | 19 |
| 30–35 | 17,688 | 239 | 58.960000 | 42 | 14 |
| 35–40 | 17,663 | 255 | 58.876667 | 41 | 12 |
| 40–45 | 17,559 | 341 | 58.530000 | 40 | 19 |
| 45–50 | 17,680 | 227 | 58.933333 | 39 | 8 |
| 50–55 | 17,543 | 401 | 58.476667 | 41 | 19 |
| 55–60 | 17,499 | 417 | 58.330000 | 42 | 19 |
| 60–65 | 17,544 | 370 | 58.480000 | 43 | 15 |
| 65–70 | 17,649 | 283 | 58.830000 | 41 | 13 |
| 70–75 | 16,485 | 726 | 54.950000 | 19 | 61 |
| 75–80 | 16,886 | 496 | 56.286667 | 26 | 45 |
| 80–85 | 16,867 | 467 | 56.223333 | 0 | 40 |
| 85–90 | 17,570 | 300 | 58.566667 | 42 | 14 |
| 90–95 | 17,428 | 421 | 58.093333 | 43 | 27 |
| 95–100 | 17,408 | 460 | 58.026667 | 42 | 24 |
| 100–105 | 17,445 | 440 | 58.150000 | 40 | 25 |
| 105–110 | 17,563 | 323 | 58.543333 | 45 | 19 |
| 110–115 | 17,498 | 370 | 58.326667 | 41 | 21 |
| 115–120 | 17,434 | 416 | 58.113333 | 42 | 22 |
| 120–125 | 17,440 | 391 | 58.133333 | 42 | 21 |
| 125–130 | 17,527 | 331 | 58.423333 | 42 | 18 |
| 130–135 | 17,440 | 404 | 58.133333 | 41 | 23 |
| 135–140 | 17,379 | 477 | 57.930000 | 41 | 27 |
| 140–145 | 17,398 | 447 | 57.993333 | 42 | 27 |
| 145–150 | 17,567 | 336 | 58.556667 | 42 | 19 |
| 150–155 | 17,456 | 364 | 58.186667 | 41 | 19 |
| 155–160 | 17,360 | 477 | 57.866667 | 41 | 31 |
| 160–165 | 17,438 | 387 | 58.126667 | 42 | 28 |
| 165–170 | 17,613 | 265 | 58.710000 | 42 | 14 |
| 170–175 | 17,478 | 403 | 58.260000 | 43 | 23 |
| 175–180 | 17,521 | 316 | 58.403333 | 42 | 18 |
Resource sampling results
The sampler reads process counters approximately every ten seconds. CPU percentages divide the actual change in cumulative CPU counters by the actual interval for each process. A value of 100% equals one core. RSS and physical footprint are separate sums of process memory stocks. They do not measure uniquely owned memory, swap or GPU memory.
| Web segment | Sample entry times (UTC) | Samples | Original result | Gap from prior final entry |
|---|---|---|---|---|
| Segment 1 | 13:20:09.732–14:18:29.765 | 351 | Failed endpoint. Valid sample prefix | — |
| Segment 2 | 14:29:10.489–14:57:10.486 | 169 | Complete | 640.724 s |
| Segment 3 | 14:58:13.751–15:26:13.766 | 169 | Complete | 63.265 s |
| Segment 4 | 15:29:06.310–15:56:16.334 | 164 | Failed endpoint. Valid sample prefix | 172.544 s |
Only segments 2 and 3 completed their declared 28-minute spans. Segments 1 and 4 retain valid sample prefixes and failed endpoints. Resource samples do not cover approximately the first 24 minutes. Later gaps remain separate. Resource samples do not cover the full three-hour run.
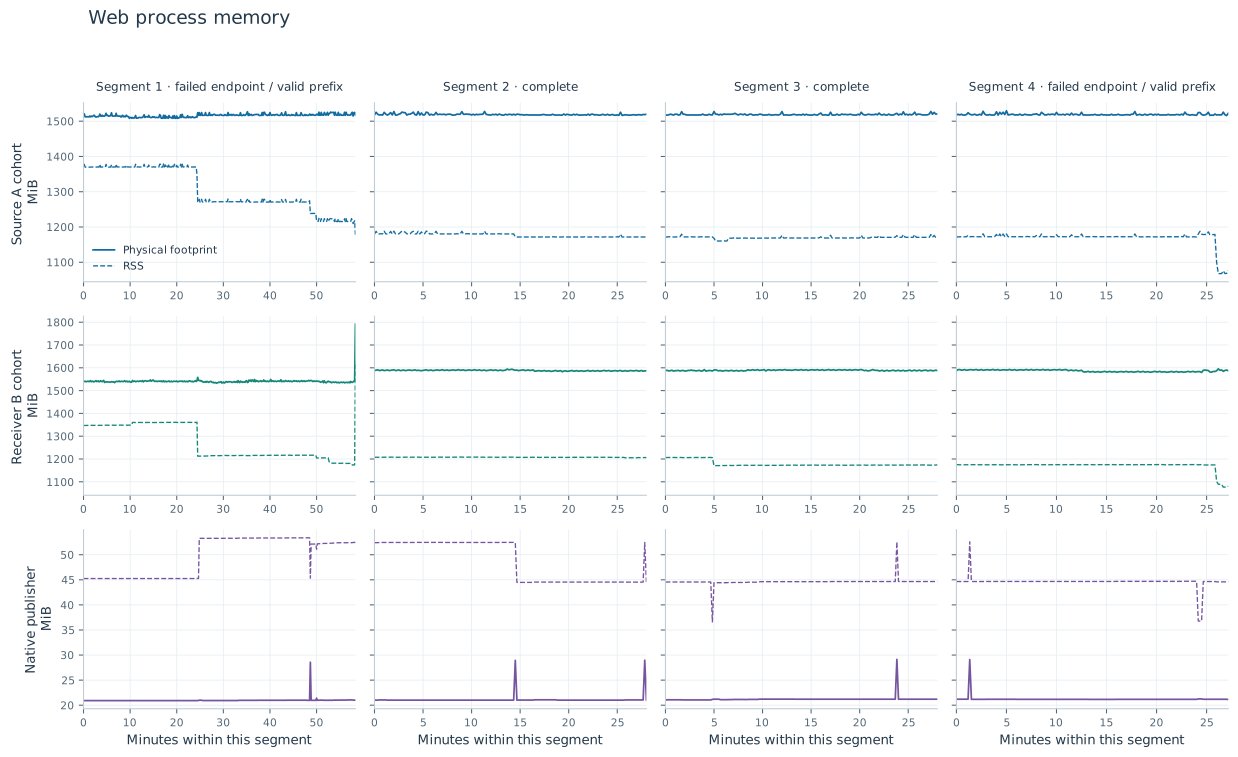
In segment 1, the receiver group’s footprint increased by approximately 252 MiB. The original processes contributed 151 MiB. Four new sampled processes contributed 101 MiB. The next two complete spans changed less. These observations do not establish a memory leak.
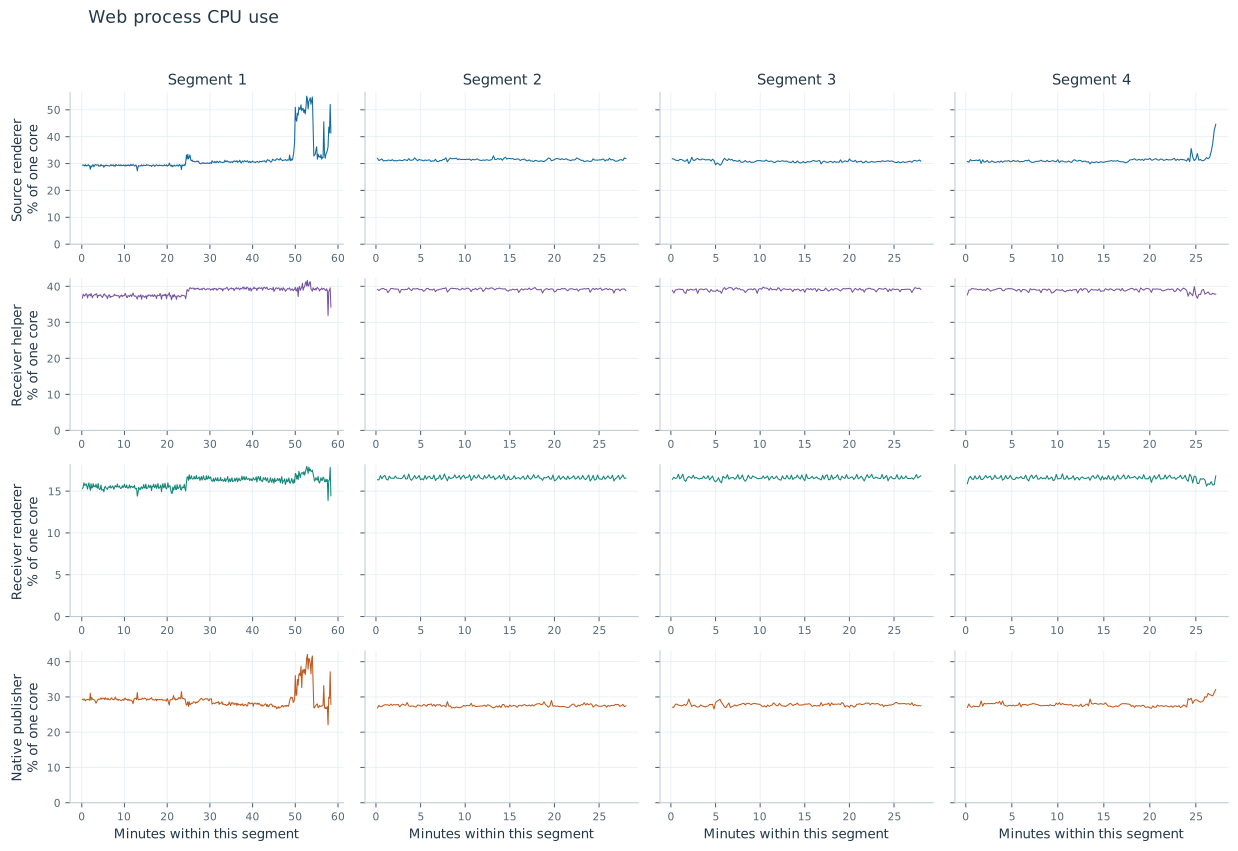
The native publisher’s CPU means were approximately 29.3%, 27.5%, 27.8% and 27.9% of one core across segments 1–4. These means use the actual interval durations as weights. Segment 4 failed while target processes stopped. It does not count as a completed observation.
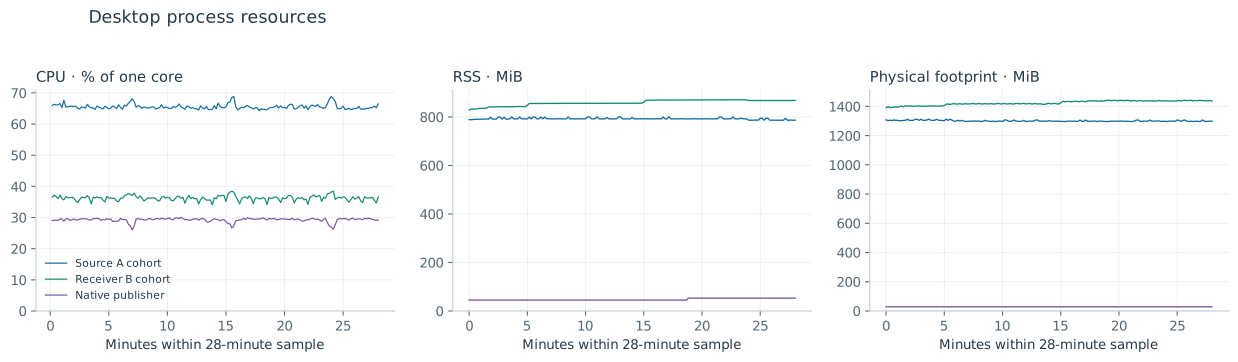
The desktop receiver group’s footprint increased by 44.28 MiB during the sampled span. The source group’s footprint decreased by 9.14 MiB. An increase in a memory stock or a decrease in RSS alone does not establish leak or swap behavior.
Limitations
- These are separate single-host research runs. The tests do not include a controlled comparison with released builds. The report does not estimate statistical uncertainty.
- The measurements include observer and sampler overhead. They do not subtract an estimate of that overhead. The investigation recorded host metadata. Browser user-agent compatibility strings do not identify the hardware.
- Marker identity checks the selected input/final association during timing. It does not establish full-color pixel equality for every timed frame or physical display delivery.
- The sampler misses processes that start and exit between samples. The report retains failed endpoints and gaps in coverage. Resource changes near a delivery gap do not establish its cause.
Source and checksum references
The JSON contains every complete one-second count, partial tails, five-minute summaries and separate resource series. A separate archive retains the original receipts and sources. Public data excludes local paths, process identifiers and private configuration.
Evidence SHA-256 values
| Web · 3 hours receipt | a5eab0112d693be578a9869a87fa445db856334fdeef23d309472101a71b2ce4 |
|---|---|
| Web · 3 hours cell journal | 62a388862a9b5a28040dc02f0d8deb1805bb36463e21143b66b15886881f6151 |
| Web · 30 minutes receipt | 0d5d92b585910ea5e9b63c2641cea75dd31408037c1df6c0dad39dd0a8c8f671 |
| Web · 30 minutes cell journal | e93b0432456a3f38ee036f60cef3a203776bcc829c4dc2753f8e4a9e0859fa2e |
| Desktop · 30 minutes receipt | 3db7da650536161a63805d9d5859f1ec16f401f2000aecb519e27e6c42197ac0 |
| Desktop · 30 minutes cell journal | 4ab42a3d5af56a3c0f7bca60412eb5cfb425eb398ad6355a6651b64062f57f49 |
| Web resources Segment 1 receipt | 68f814736e23a7794b6e2332f269598393d3a27219c95aea4cf309798a01a66f |
| Web resources Segment 2 receipt | a3a53eeda320107efd4558ae32ab58b4f2d67867a7f992f211dd012ba40c4c37 |
| Web resources Segment 3 receipt | 6d057592801165b0d766b09541d850a0b661c5f112449a13f7707738603f4878 |
| Web resources Segment 4 receipt | 2ff8b45dfd47ce1e2449a6989fb712b142445a98396ee78b4041a0665f81fb5e |
| Desktop resource receipt | f35cbd082df440ee0f35c026d8030437e2b6ddd4260792909eb0a934bd76bc9d |
| Research fixture manifest | 2c96ae157ae78d272f88f806bd3907823543273b6da0a67bd03937951408dfc6 |
| Research native executable | b960a686d44eeeba51a8b519c875ad955bffbc0b32e2cccf1e1c4e299b6aa344 |
| Archived source manifest | c8fbc0fbadf56459012adb964bbe53a7efeab98285e8a7c31c3a8e371850d8c0 |
| Independent FPS audit | fe30b0d9e1f3acba55920aa86c7e4ccf3d478353a258d8ffd9faa2b1b38ecb63 |
| Independent resource audit | 984168b745fca20f2a9b37b156c8f37a1181645ed448779eaba6d8df101cd06f |
| SDK served-byte proof | 8b4f22609d63bdbaf67e0e1e2c732ac5a7f43583103483b7ccfacd8ae1699f21 |
| Sync 0.2.57 release JSON | 4c33d55a99f610a68df70efc473d903addfef13e005248e115901f7472338b6e |
| Release and guide public proof | 01250a785bcd335d8db0a38d11dd1fe43e18ff9da15bc427db9bd19238a8fbfa |