Direct RGBA receive: fixed HTTP send-buffer diagnostic
Configuration and method
NCPU is the parent native CPU diagnostic. NSB adds one fixed HTTP socket send-buffer request.
The native server requests 262,144 bytes after source and ticket authentication, before it submits response headers.
All eight NSB connections recorded a successful get, set and get sequence. Each read 146,988 bytes before the request and 262,144 bytes after it.
The request increased the observed value. The parent did not record that option, so its initial value is unknown.
Both arms use the same BUDGET2 browser and source code. The source limit is 16,588,928 bytes and receiver credit remains one.
Noisedeck A sends 1920 × 1080 RGBA packets through Sync to Noisedeck B. Native camera publication remains active. B uses the HTTP BYOB reader.
The native executables differ. The packet layout, write path, CPU recorder and deadline rules remain unchanged.
The tests use GLSL and synth.testPattern. Timing uses pattern 0 with gridSize 4. Pixel controls use pattern 5 with gridSize 16.
Retained host metadata identifies an Apple M2, eight logical CPUs, 24 GiB of memory and Darwin 23.6.0.
Observed power samples show AC power. They do not prove continuous AC power between reads. The tests collected no in-run thermal or frequency data.
Delivery observations
The report contains 16 valid diagnostic gates and one rejected parent attempt. Each arm has four pixel controls, two five-second observations and two three-minute observations.
A valid diagnostic does not imply a passed delivery checkpoint. All eight NSB diagnostic gates passed. Both long delivery checkpoints failed.
NSB web delivered 18.312851 unique pairs/s and desktop delivered 16.320944. Each had 174 complete seconds below 50.
The minimum complete second was five pairs on web and one on desktop. All low cells remain in the data.
The NCPU parent delivered 54.863649 pairs/s on web and 58.467740 on desktop. The measured spans are separate sequential runs.
The measured throughput does not meet release requirements for this fixed setting. This comparison does not establish exclusive causation.
All 720 complete long-run B seconds, 20 short-run seconds and eight partial tails remain available. Input and final markers must match in the same render.
Rates use the full B measurement span, including the partial tail. The diagrams use a shared 0–66 scale.
Open full-size diagram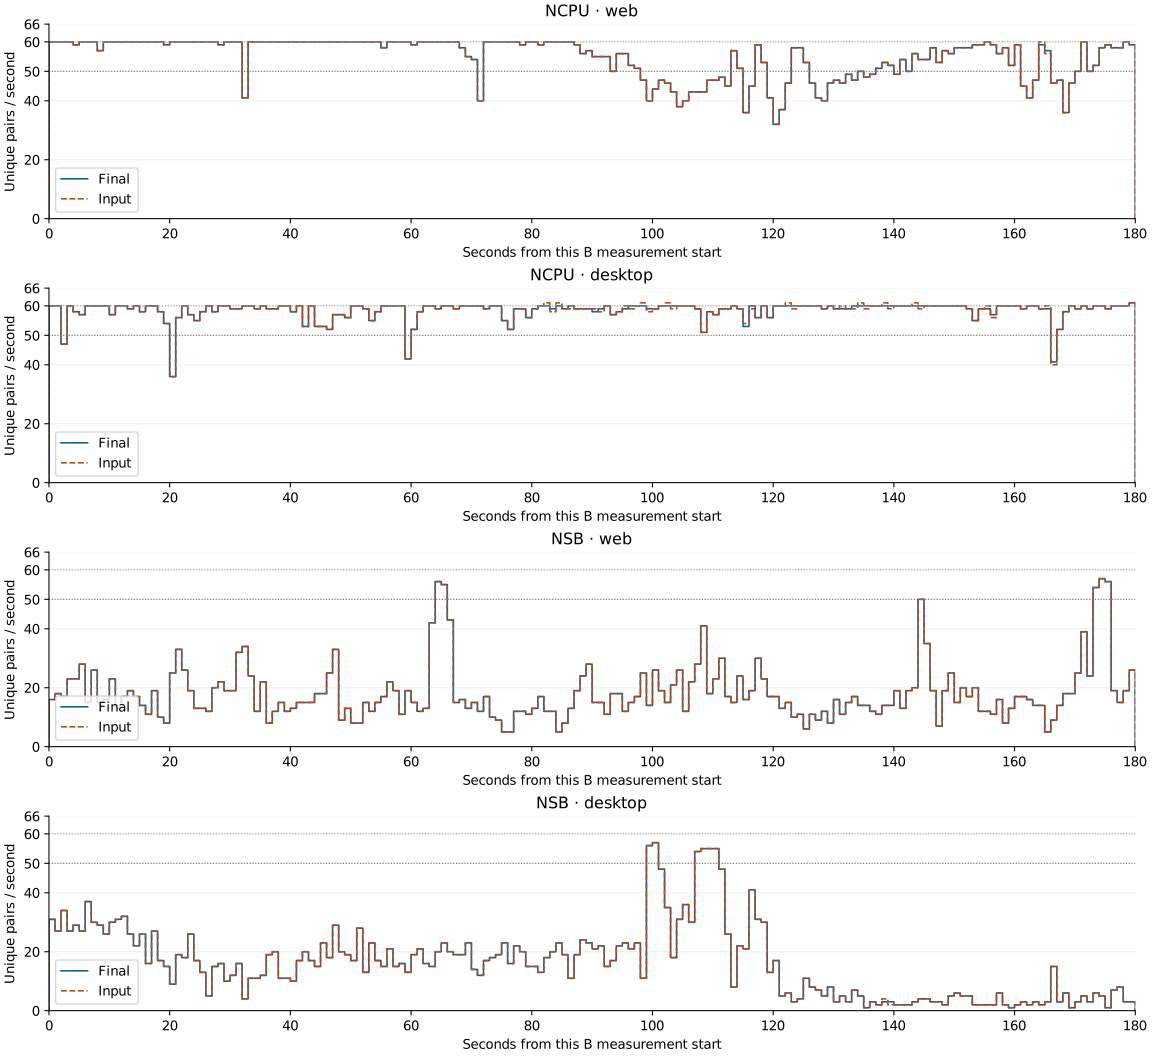 Separate B clocks. All 720 complete seconds use 0–66. The tables retain all partial tails. Solid blue: final. Dashed orange: input.
Native submission and completion
The submission elapsed interval surrounds the synchronous uv_write call. The outer CPU interval includes calling-thread CPU clock reads around that interval.
The CPU difference is not the exact CPU time of the inner write interval. The diagnostic subtracts no overhead.
The callback elapsed interval includes submission and continues to the actual callback. It includes work after the call returns, waiting and scheduling.
These intervals are not additive. Neither callback elapsed nor elapsed minus CPU identifies a network, GPU or scheduler cost.
NSB had shorter mean submission time and much longer mean callback elapsed time than the parent. The socket setting can defer work into later completion.
That mechanism does not establish an exclusive cause for the delivery difference. The report retains both native measurements and actual delivery.
All native values cover setup through cleanup. They have no measured alignment to either page clock.
Open full-size diagram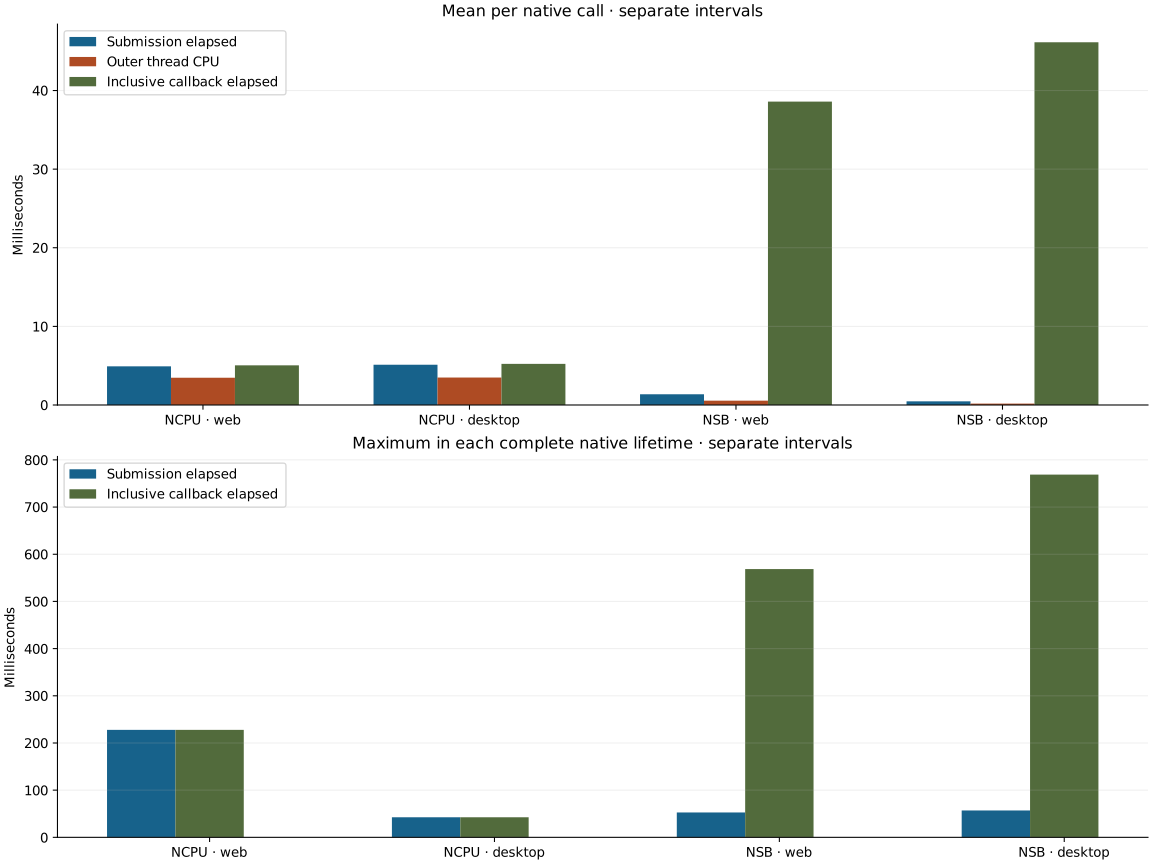 Complete native lifetimes. Each mean uses its own stage count. Callback elapsed includes submission and must not be added to it. The maximum submission and callback values need not belong to the same call.
Retained records and event loss
The separate CPU recorder retained all slow calls. The parent recorded seven web and two desktop calls. NSB recorded five web and two desktop calls.
The older six-stage ring retained 256 records per long run. It overwrote 785 parent web records and 92 parent desktop records.
It overwrote 5,845 of 6,101 NSB web records and 4,449 of 4,705 NSB desktop records. These counts include all six stages.
Aggregate stage counts, totals and maxima remain available. They cannot reconstruct lost individual callbacks.
The slow-record diagram shows complete CPU slow records and only retained slow callbacks. The callback sample is a tail, not a complete distribution.
Exact sequence, generation and native start timestamps can join retained write records. A missing match remains unknown.
Open full-size diagram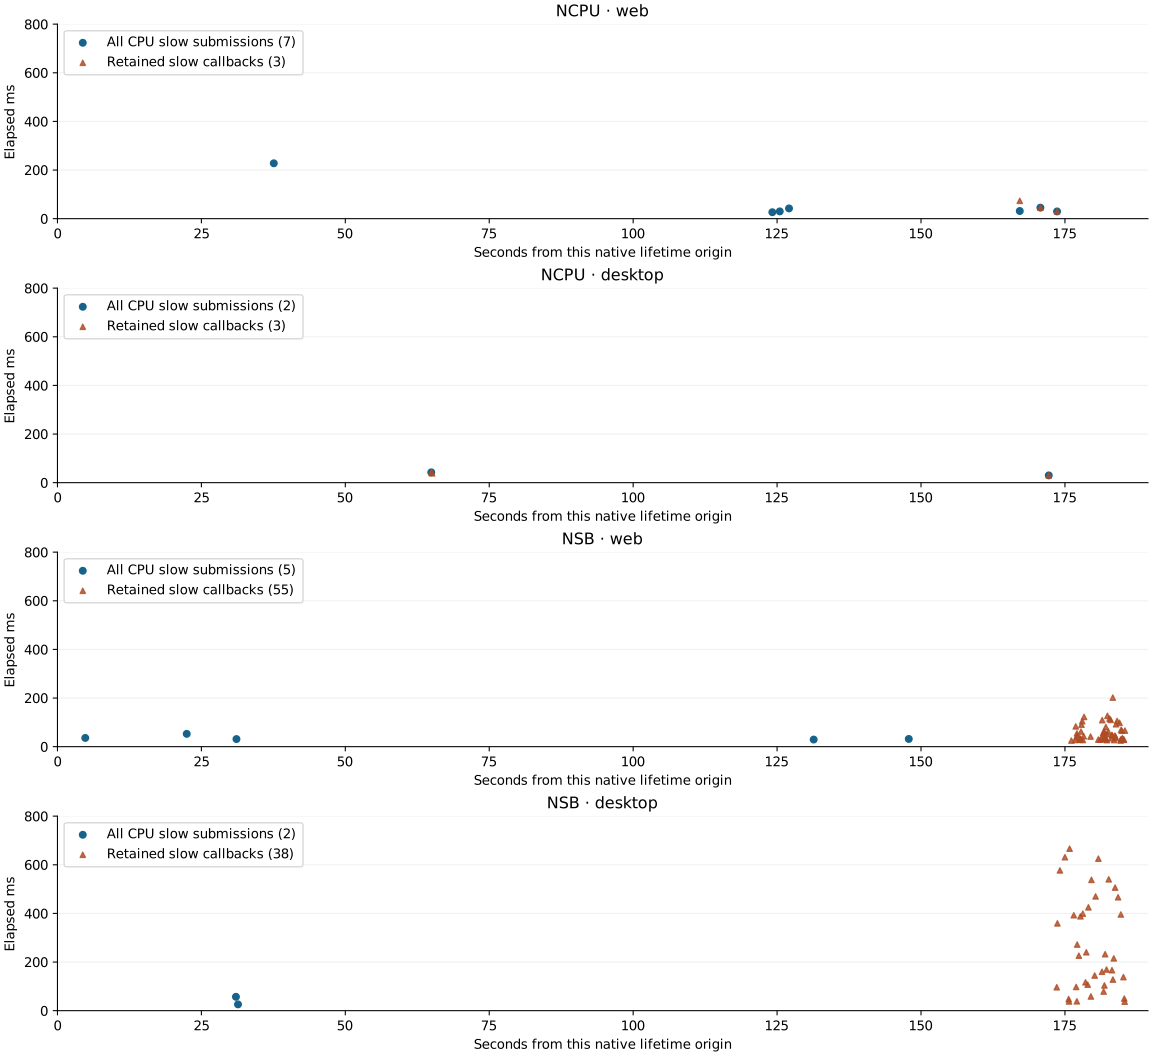 Native clocks only. Blue circles show every CPU slow submission. Orange triangles show retained slow callbacks from a ring shared by six stages. Missing earlier orange points do not indicate an absence of callbacks. All panels use 0–800 ms.
Source intervals and diagnostic cost
Measured A source intervals recorded 541 parent web drops and 152 parent desktop drops. NSB recorded 3,213 web drops and 3,098 desktop drops.
The source recorder retains positive pressure checks and actual drops. It does not measure continuous socket occupancy.
Positive checks and their actual drops are separate events. Drop totals count only actual drop records.
All pressure phases, thresholds, raw points and startup history remain in the numeric data. Source intervals use their own A clocks.
The pressure recorder, page observers, journal writes and native CPU reads can affect execution. There is no uninstrumented comparison with identical scheduling conditions.
The CPU recorder retains 22,744 bytes. The report lists its elapsed clock-read brackets separately. They do not measure total diagnostic overhead.
Rejected parent attempt
NCPU web-observe5-ncpuv2-a1 stopped during measurement. Its source renderer was not running before cleanup. The stop caller was not recorded.
It has no accepted rate or accepted B cell journal. The unchanged five-second repeat passed and remains a separate result.
All actual owned processes exited. Source, pressure and cell journals are incomplete. A and B telemetry journals are complete.
The rejected native lifetime independently recorded 358 writes and one slow write. Its native evidence remains separate from delivery comparisons.
The slow frame sequence was 52 and the source start-cut sequence was 312. These values do not align native and page clocks.
NSB completed all eight gates on their first attempts. Low delivery rates did not cause those valid diagnostics to be discarded.
Limitations and references
GPU contention on the busy test machine is a working hypothesis for intermittent source-entry gaps. These tests did not measure GPU scheduling or contention.
This hypothesis is not an established explanation for the poor throughput of the socket arm.
These are sequential macOS measurements, not a cross-platform certification, a causal ranking or an hours-long performance claim.
The data does not establish an end-to-end latency change, a garbage collection cause or external camera delivery.
The earlier reports remain unchanged. Numeric data contains exact result, source, receipt and journal digests. Private logs and credentials remain outside this report.
Numeric data · Text report · Checksums
Parent native CPU report · Separate source encoder report