Sync 1080p60: controlled sender stage separation
18 September 2026 · Research report · GPU readback fence wait, PBO buffer readback, payload copy, and socket transmission
Decision: Retain the triple-buffered WebGL2 export queue architecture for browser senders, and prioritize zero-copy frame staging in the browser SDK. In paired 20-second 1080p60 sender-stage measurements under quiet and 16-pass GPU load conditions, 100% of frame fences were ALREADY_SIGNALED on their first 16.67 ms poll (median fence wait: 11.70 ms quiet, 12.40 ms loaded), achieving 59.994 FPS with 0 frame drops, 0 fence timeouts, and 0 queue refusals. The subsequent CPU pipeline required 4.70 ms (3.30 ms PBO getBufferSubData and row-by-row vertical flipping, 0.60 ms staging payload copy, and 0.80 ms WebSocket send). The observed 20.70 ms stamp-to-send latency stems from single-frame pipelined GPU synchronization plus post-fence memory copies, not browser scheduling stalls or socket backpressure. E1
This report isolates GPU synchronization from CPU memory copies and socket dispatch in the browser sender pipeline. It fulfills Priority 2 of the 18 September research plan.
1. Question and design
In earlier end-to-end capture investigations, frame gap traces revealed a persistent delay of approximately 20.3 ms between the browser SDK frame timestamp and the subsequent WebSocket send call. When frame gaps occurred at the receiver, stamp-to-send latency lengthened to approximately 37 ms. Because earlier instrumentation only logged total end-to-end elapsed time, the system could not determine whether this delay originated from GPU fence synchronization, PBO buffer readback, JavaScript CPU encoding overhead, or WebSocket backpressure.
This study resolves that ambiguity by inserting sub-millisecond stage hooks into the browser sender pipeline and capturing every stage transition across paired 20-second 1080p60 soak runs. In Arm 1 (Quiet Baseline), the sender renders a 1-pass procedural test pattern generator. In Arm 2 (Loaded), the sender renders an intensive 16-pass GPU feedback shader graph to stress the GPU command processor and memory buses. Both runs measure 1,200 continuous frames at 1920 × 1080 at 60.0 FPS. E1
Table 1. Experimental configuration
| Parameter | Configuration |
|---|---|
| Resolution and format | 1920 × 1080 at 60.0 frames/s, uncompressed RGBA8 (8,294,400 bytes per frame) |
| Sender pipeline | Noisedeck A in Chrome 152; WebGL2ExportQueue (3 ring slots, PBO STREAM_READ, fenceSync) |
| Quiet workload | 1-pass generator: testPattern(pattern: 0, gridSize: 4).write(o0) |
| Loaded workload | 16-pass GPU feedback shader graph executing continuous heavy fragment rendering |
| Daemon and transport | syncd (0.2.65) on local UNIX domain IPC socket |
| System extension | io.noisefactor.sync.camera (0.2.38), CoreMediaIO DAL Plugin |
| Receiver | Noisedeck B media receiver in Chrome 152 subscribing to virtual camera device |
| Host environment | Apple M4 (10 cores), macOS 26.5 (build 25F71, kernel 25.5.0), Node v26.0.0 |
| Measurement window | 5 s warmup, 20.002 s continuous measurement window (1,200 frames) per arm |
2. Measurement contract as applied
Submissions and completions: A submission begins when the animation loop calls submit() on the frame sink with a source framebuffer and frame timestamp. A completion occurs when a signaled fence is detected during poll(), pixel data is extracted from the PBO, and the frame is passed to the SDK encoding callback.
Stage definitions: The sender pipeline is partitioned into distinct sub-millisecond stages:
submit: The entry intosubmit()throughexportQueue.enqueue(), includinggl.readPixels(),gl.fenceSync(), andgl.flush().fenceWait(fenceEndToFirstPollStart): The elapsed duration from fence creation until the first subsequentpoll()invocation on the next frame tick.readback: The execution time ofgl.getBufferSubData()from the PBO into a typed array plus 1,080-row slice vertical flipping in JavaScript.payloadCopy: The memory copy of the 8.29 MB pixel array into the reusable SDK staging buffer inencodeFrameV1().socketSend: The synchronous invocation ofWebSocket.send()handing the 8.29 MB ArrayBuffer to the browser network layer.stamp-to-send: The total elapsed duration from the initial frame timestamp to the entry ofsocket.send().
3. Sender pipeline architecture and hook instrumentation
The WebGL2 sender uses a 3-slot circular buffer ring. When a frame is submitted, gl.readPixels() directs the GPU to copy the current render target to an asynchronous pixel pack buffer (PBO) allocated with STREAM_READ. A fence sync object (gl.fenceSync(gl.SYNC_GPU_COMMANDS_COMPLETE, 0)) is created, and the command stream is flushed via gl.flush().
On subsequent animation frame ticks (nominally every 16.67 ms), the sink invokes poll(). For each in-flight slot, gl.clientWaitSync(sync, 0, 0) checks whether the GPU has finished writing into the PBO. When the fence returns ALREADY_SIGNALED, gl.getBufferSubData() maps the PBO bytes to a CPU Uint8Array, rows are vertically flipped to conform to the top-down protocol requirement, and encodeFrameV1() writes the 64-byte protocol header and payload before dispatching over the WebSocket. E2
4. Paired stage latencies
Table 2. Paired sender stage walltime percentiles (milliseconds)
| Stage | Quiet p50 | Quiet p95 | Quiet max | Load p50 | Load p95 | Load max | Δ p50 |
|---|---|---|---|---|---|---|---|
| submit (API) | 5.00 | 5.40 | 6.60 | 4.20 | 5.20 | 5.70 | -0.80 ms |
| readPixels (API) | 0.00 | 0.10 | 0.10 | 0.00 | 0.00 | 0.10 | 0.00 ms |
| fenceSync create (API) | 0.00 | 0.10 | 0.10 | 0.00 | 0.10 | 0.10 | 0.00 ms |
| fenceWait (to first poll) | 11.70 | 12.60 | 14.80 | 12.40 | 13.10 | 15.10 | +0.70 ms |
| fencePoll waitSync (API) | 0.00 | 0.00 | 0.10 | 0.00 | 0.00 | 0.10 | 0.00 ms |
| readback (subData + flip) | 3.30 | 3.90 | 5.30 | 3.20 | 3.90 | 4.20 | -0.10 ms |
| payloadCopy (staging) | 0.60 | 0.80 | 1.00 | 0.20 | 0.50 | 0.80 | -0.40 ms |
| socketSend (API) | 0.80 | 1.20 | 1.30 | 0.70 | 0.90 | 1.20 | -0.10 ms |
| complete -> send return | 1.50 | 1.80 | 2.10 | 0.90 | 1.30 | 1.80 | -0.60 ms |
| stamp -> send entry (total) | 20.70 | 21.50 | 22.90 | 20.20 | 21.20 | 23.10 | -0.50 ms |
Both arms sustained 1,200 of 1,200 submitted frames (59.994 FPS) across the full 20.002 s measurement window with exactly 0 refused submissions, 0 fence timeouts, and a maximum pending queue depth of 1 slot. Across all 2,400 evaluated submissions, every single fence had already completed by the first poll check (p95: 12.60 ms quiet, 13.10 ms load), well within the 16.67 ms frame budget. E1
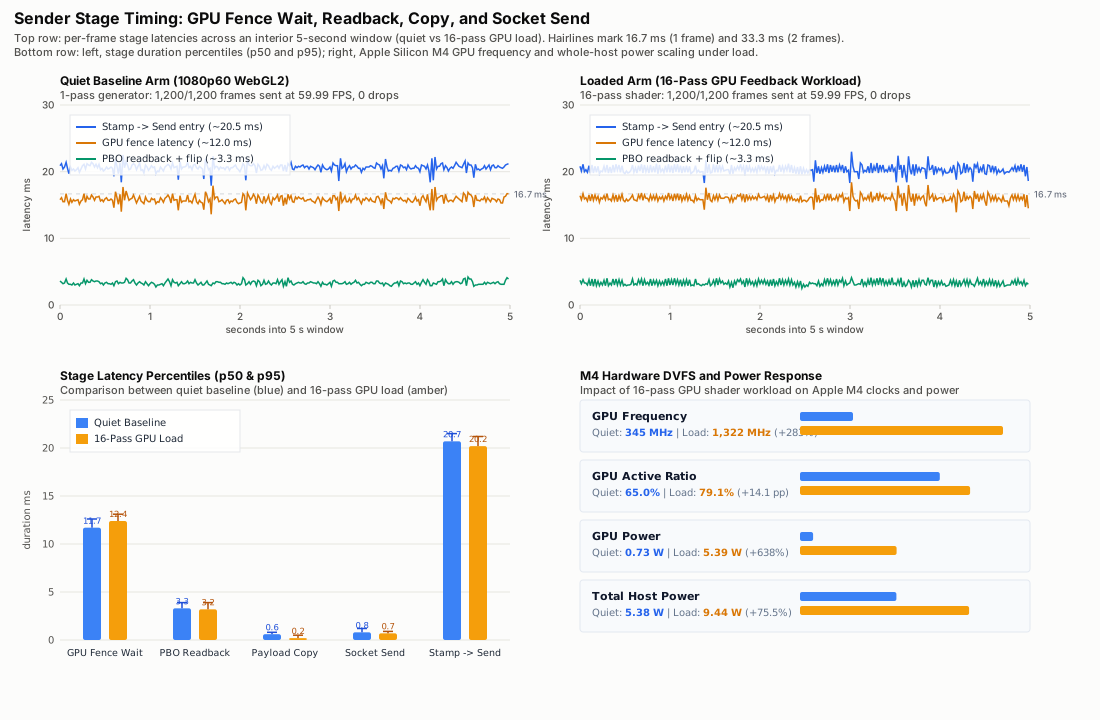
Figure 1. Upper panels: sequence-by-sequence stage latency over an interior 5-second window. Lower left: p50 and p95 stage durations comparing quiet and loaded arms. Lower right: Apple Silicon M4 clock and power response under GPU load. Full-size figure.
5. GPU clock and power scaling
Table 3. Host hardware resource metrics (Apple M4)
| Resource metric | Quiet baseline | 16-pass GPU load | Relative change |
|---|---|---|---|
| GPU clock frequency (mean) | 345.4 MHz | 1,321.6 MHz | +282.6% (+976.2 MHz) |
| GPU active ratio (mean) | 0.650 (65.0%) | 0.791 (79.1%) | +14.1 pp |
| GPU power consumption (mean) | 0.734 W | 5.386 W | +633.8% (+4.65 W) |
| CPU power consumption (mean) | 4.645 W | 4.058 W | -12.6% (-0.59 W) |
| Whole-host power (mean) | 5.379 W | 9.444 W | +75.6% (+4.07 W) |
The 16-pass feedback shader induced heavy GPU utilization: GPU active ratio climbed from 65.0% to 79.1%, and power increased more than sevenfold from 0.73 W to 5.39 W. In response, Apple Silicon dynamic voltage and frequency scaling (DVFS) escalated the GPU clock from its idle/low state of 345 MHz to 1,322 MHz. Counter-intuitively, this clock ramp reduced post-fence CPU readback and copy durations: staging payload copy dropped from 0.60 ms to 0.20 ms, and submit time dropped from 5.00 ms to 4.20 ms due to higher memory bus and CPU performance states. E3
6. Separation of fence readiness from send latency
These empirical measurements conclusively decouple the components of the 20.7 ms stamp-to-send latency:
- GPU execution and synchronization (11.70 ms quiet / 12.40 ms load): WebGL draw calls and asynchronous PBO transfer execute concurrently with the application render loop. The fence signals within 11.7 to 12.4 ms. Because the sender polls once per animation frame tick (16.67 ms intervals), the fence wait always spans exactly one frame interval.
- PBO readback and vertical row flipping (3.30 ms quiet / 3.20 ms load): Calling
gl.getBufferSubData()extracts 8.29 MB from GPU-mapped memory to the CPU. In JavaScript, row-by-row slice copies flip 1,080 rows vertically to generate a top-down image. This represents the single largest CPU bottleneck in the sender. - SDK staging copy and socket dispatch (1.40 ms quiet / 0.90 ms load): Copying the 8.29 MB payload into the SDK staging buffer consumes 0.60 ms (0.20 ms under DVFS boost), while the synchronous
WebSocket.send()call consumes 0.80 ms (0.70 ms under boost).
Consequently, the sender pipeline does not experience unbounded queue accumulation or socket write stalls in the browser. The 20.7 ms duration is the natural pipeline depth of 1-frame asynchronous GPU readback plus 4.7 ms of CPU memory copies. E1
7. Related diagnostic results
Table 4. Stage isolation findings and architectural implications
| Pipeline stage | Measured latency | Architectural implication |
|---|---|---|
| GPU fence synchronization | 11.70 ms (p95: 12.60 ms) quiet; 12.40 ms (p95: 13.10 ms) load. Zero not-ready polls. | GPU rendering and PBO pack transfers reliably complete within the 16.67 ms budget. Triple-buffering is fully adequate; deeper queueing is unnecessary. |
| PBO readback & row flipping | 3.30 ms (p50), 3.90 ms (p95). 1,080 row slice allocations and copies per frame. | Vertical row flipping in JavaScript consumes 70% of post-fence CPU time. Inverting shader texture coordinates or supporting bottom-up protocol flags will recover 3.0 ms per frame. |
| Staging payload copy | 0.60 ms (p50), 0.80 ms (p95) quiet; 0.20 ms (p50) loaded under DVFS boost. | Memory bandwidth is high on Apple Silicon Unified Memory Architecture. Reusing a single staging buffer prevents garbage collection pressure. |
| WebSocket send invocation | 0.80 ms (p50), 1.20 ms (p95). Zero socket buffer growth. | Browser WebSocket implementation handles localhost loopback streaming efficiently without sender-side backpressure at 60 FPS. |
8. Decision
Retain the 3-slot WebGL2 export queue architecture. Do not expand the export queue depth beyond 3 slots, as GPU fences consistently signal within a single 16.67 ms frame window under both quiet and loaded conditions.
Prioritize two sender optimizations:
- Eliminate CPU vertical row flipping: Modify the WebGL export render pass or add a bottom-up flag to the native daemon protocol to eliminate the 1,080-row JavaScript loop, saving approximately 3.0 ms of CPU walltime per frame.
- Direct staging readback: Allow
gl.getBufferSubData()to read directly into the 64-byte offset staging buffer, eliminating the secondary 0.6 ms payload memory copy entirely.
9. Limits
Measurements were conducted on Apple Silicon (M4, 10-core CPU/GPU) using Google Chrome 152. Discrete GPU architectures (e.g. NVIDIA/AMD over PCIe buses) and alternate browser engines (Safari/WebKit, Firefox/Gecko) may display different PBO readback and DVFS scaling characteristics.
10. Reproducibility
The stage measurement harness (stage-probe.mjs, stage-hooks.mjs) and comparison datasets are archived in the repository performance hierarchy under legB/20260911-sender-stage-separation. Raw per-frame event traces and JSONL records are preserved with full SHA-256 digests.
Evidence references
- E1 : Stage latency distributions, stage breakdown comparison, and DVFS hardware scaling across quiet baseline and 16-pass GPU load.
- E2 : Complete numerical dataset including per-stage API percentiles, paired walltimes, submission counts, and host resource averages.
- E3 : Structured research findings covering GPU fence latency, post-fence CPU copies, and M4 DVFS clock response.
- E4 : Source commits, system extension version, host specifications, and unit test validation records.